What is the VIX?
Join thousands of savvy investors and get:
- Weekly Stock Picks: Handpicked from 60,000 global options.
- Ten Must-Have Stocks: Essential picks to hold until 2034.
- Exclusive Stock Library: In-depth analysis of 60 top stocks.
- Proven Success: 10-year track record of outperforming the market.
The CBOE Volatility Index (INDEXCBOE: VIX), better known as the VIX, is a gauge of the market's future volatility. Founded by the Chicago Board Options Exchange (CBOE), it is an indicator of the expected price fluctuations of the S&P 500 Index Option (INDEXSP: INX) over the next 30 days. The index rises in tandem with the expected volatility of the market. It is also known as the Fear Index or the Fear Gauge and is used by investors and traders alike as a signal for the level of fear and anxiety within the market.
Read more from MyWallSt:
It's important to note that it is a forward-looking index and is not based on past performance and historical data like traditional measures of volatility, rather the expected or implied volatility for the proceeding month. As such, while closely correlated, the VIX is not a measure of actual volatility.

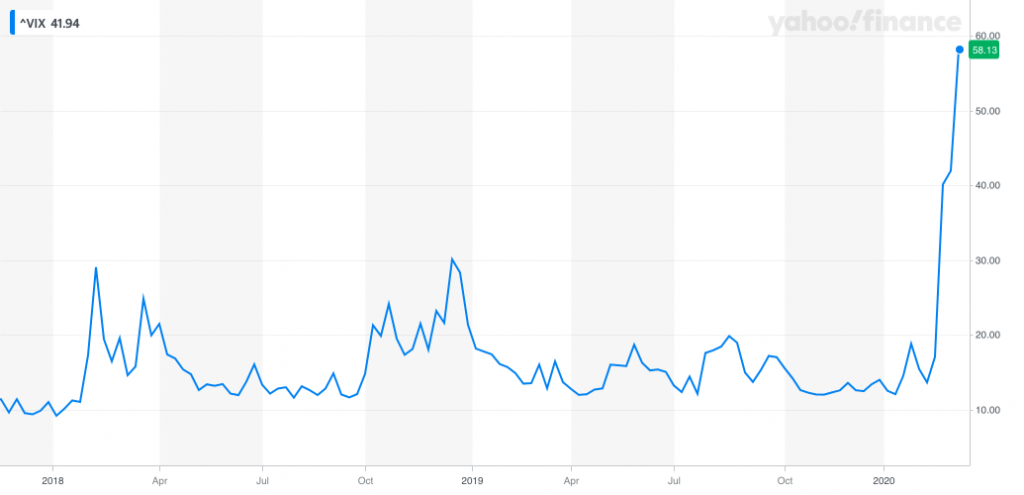
When looking at VIX, there is a general rule of thumb: values greater than 30 indicate a time of increased volatility and fear amongst investors, while values under 20 signify more stability and predictability within the market. As we can see from the chart above, the three significant spikes in the VIX in February and March of 2018, December 2018, and February and March of 2020 represent the three most significant dips in the performance of the S&P 500 (NYSEARCA: VOO) we've seen in the last two years.
What is probably most worrying is its current level, in comparison to those times. It is the highest the index has reached since the Great Financial Crisis of 2008.
How is the VIX calculated?
The index is calculated in real-time by the CBOE based on the prices of options on the S&P 500 index. In an oversimplification of an incredibly complex process, the higher premium you have to pay on an option, the higher the risk. As such, the VIX moves in accordance with this figure. The higher the premium, the higher the risk, the higher the index.
It's pertinent to note that due to the index concentration of the S&P 500, Apple (NASDAQ: AAPL), Amazon (NASDAQ: AMZN), Google (NASDAQ: GOOG), Microsoft (NASDAQ: MSFT), and Facebook (NASDAQ: FB) make up around 18% of the index, VIX may become skewed if there are any issues that threaten these tech giants specifically. For example, Elizabeth Warren's promise to break up big-tech.
For those interested in a full explanation, check out the report from the CBOE.
What does a low VIX mean?
While it is clearly more favorable than higher levels, a particularly low VIX is not seen as a good thing. It indicates complacency and an overly optimistic market. Significantly low levels could indicate irrational exuberance, a sign of overconfidence that usually leads to an overpriced market and a subsequent sell-off.
In hindsight, one could look at the recent meteoric rise of meme stocks like Tesla (NASDAQ: TSLA), Virgin Galactic (NYSE: SPCE), and Advanced Micro Devices (NASDAQ:AMD) as evidence that irrational exuberance already existed. Perhaps a sell-off was inevitable and the coronavirus was just the catalyst that pushed it over the edge?
Quickfire round
Times of high volatility are usually when investors move their money from equities to safer havens like government bonds. As such, if the VIX indicates times of high expected volatility, the market will usually initiate a sell-off.
As stated earlier, below 20 indicates times of stability within the market. However, too low indicates complacency and over-exuberance. While it is hard to identify an optimum level for the VIX, between 12 and 20 usually indicates a strong, but not overconfident, market sentiment.
Like stocks, the VIX can technically go to zero, although the likelihood is minuscule. The lowest it has reached since January 2000 was 9.14 in late 2017.
MyWallSt operates a full disclosure policy. MyWallSt staff currently holds long positions in Amazon, Apple, Facebook, Microsoft, Google, Tesla, and Virgin Galactic. Read our full disclosure policy here.
- Weekly Stock Picks: Handpicked from 60,000 global options.
- Ten Must-Have Stocks: Essential picks to hold until 2034.
- Exclusive Stock Library: In-depth analysis of 60 top stocks.
- Proven Success: 10-year track record of outperforming the market.
